One of the most interesting and technically rewarding projects I worked on at QWSoftware was building a visual monitoring dashboard for Virtual Machines running on VMware infrastructure. This wasn’t just another dashboard — it was designed to integrate tightly with QWVA, our custom orchestrator used by several large public sector organizations. The idea was to help operations teams keep track of thousands of VMs in real time, without getting lost in metrics or needing to jump between tools.
It all started with the need to pull a huge amount of information from VMware’s vSphere API — things like CPU, memory, disk usage, VM state, and the infrastructure hierarchy (clusters, hosts, pools). I built a backend in Java and Groovy using Grails, designed to fetch and organize this data in a way that wouldn’t overload the system. To keep it lightweight and responsive, I implemented a caching strategy with TTL and an observer-style update flow — so we only processed and pushed changes, not entire datasets every few seconds.
Then came the frontend — and this is where the user experience had to shine. I created a visual layout that grouped VMs by environment, making it easy to see how everything was performing at a glance. Each VM card showed key stats and status colors, and the interface responded instantly thanks to WebSockets keeping the connection live. There were also filters for everything: cluster, pool, host, status, time window. The operators could go from a broad overview to very specific cases in just a few clicks.
One of the biggest technical challenges was making the whole thing scale. We were dealing with environments running over 3,000 VMs, and I had to ensure that the system would remain smooth and snappy under that load. With the backend optimizations, caching, and event-driven updates, we managed to get near-instant updates with very low resource usage — something I’m genuinely proud of.
In the end, the tool became essential for daily operations. The team could detect issues faster, understand resource usage more clearly, and react to problems in real time. And for me, it was a great example of how thoughtful backend architecture and a clean, interactive frontend can come together to solve real problems in complex infrastructure environments.

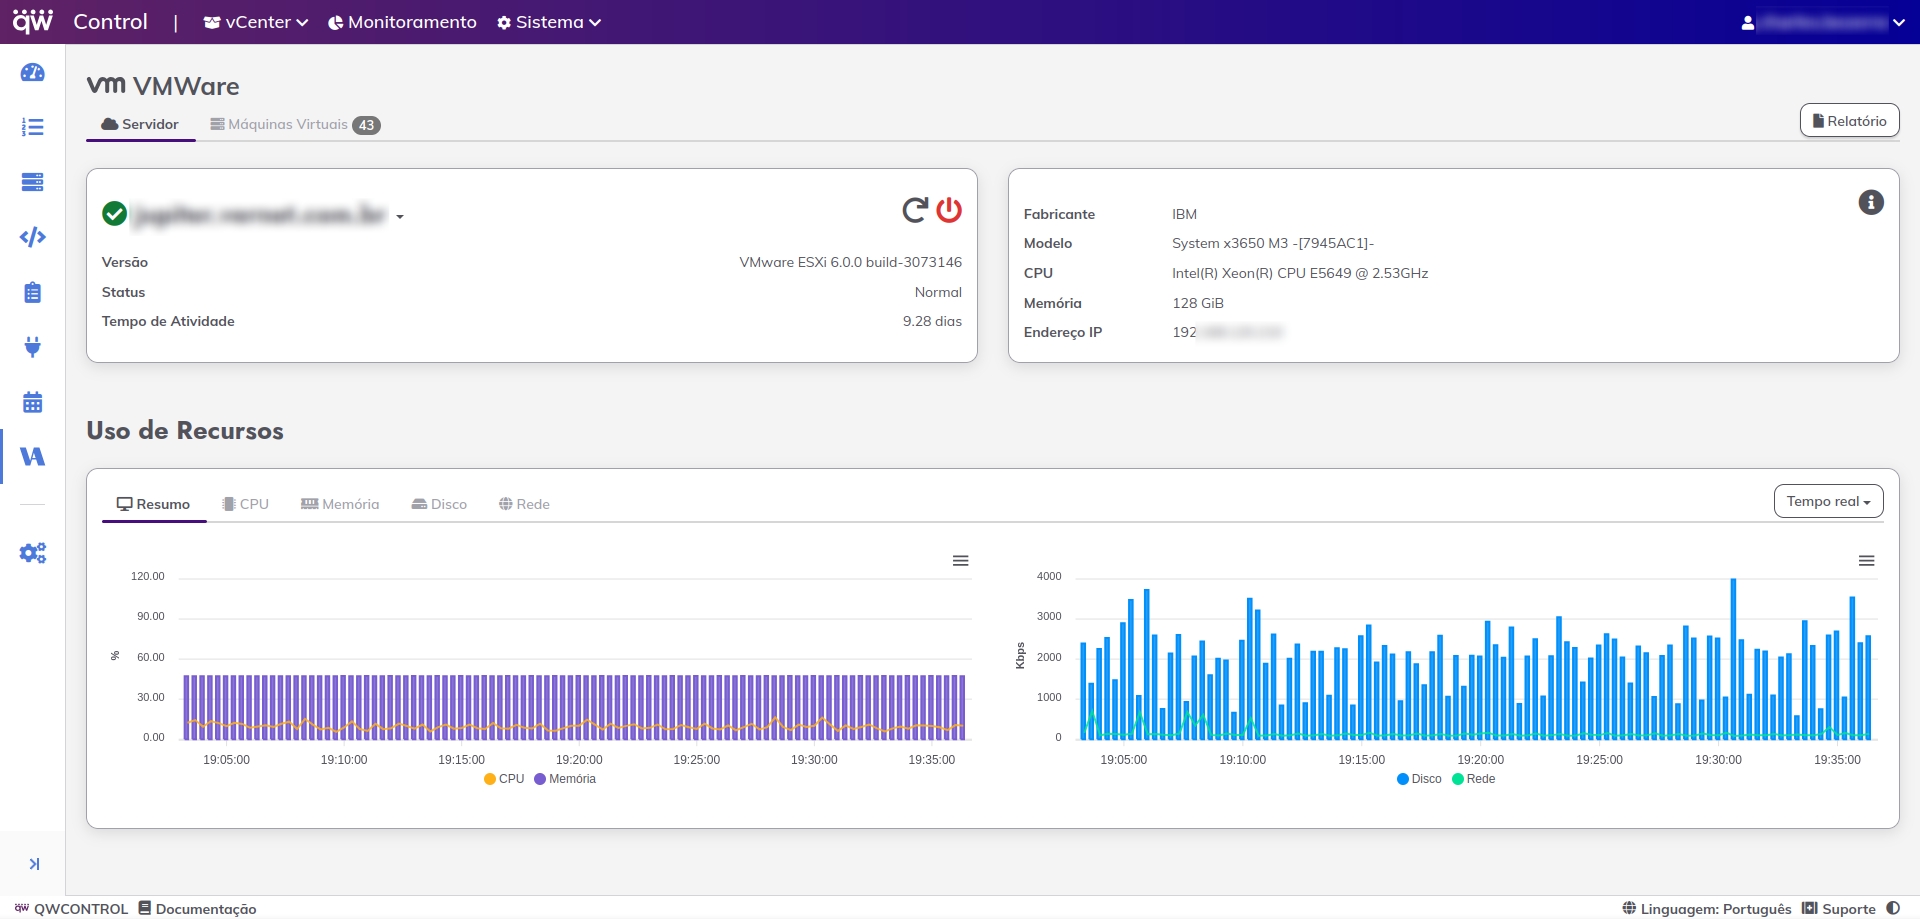
A detailed view of the physical host server, including vendor, hardware specifications, uptime, and real-time resource usage graphs for CPU, memory, disk, and network activity.

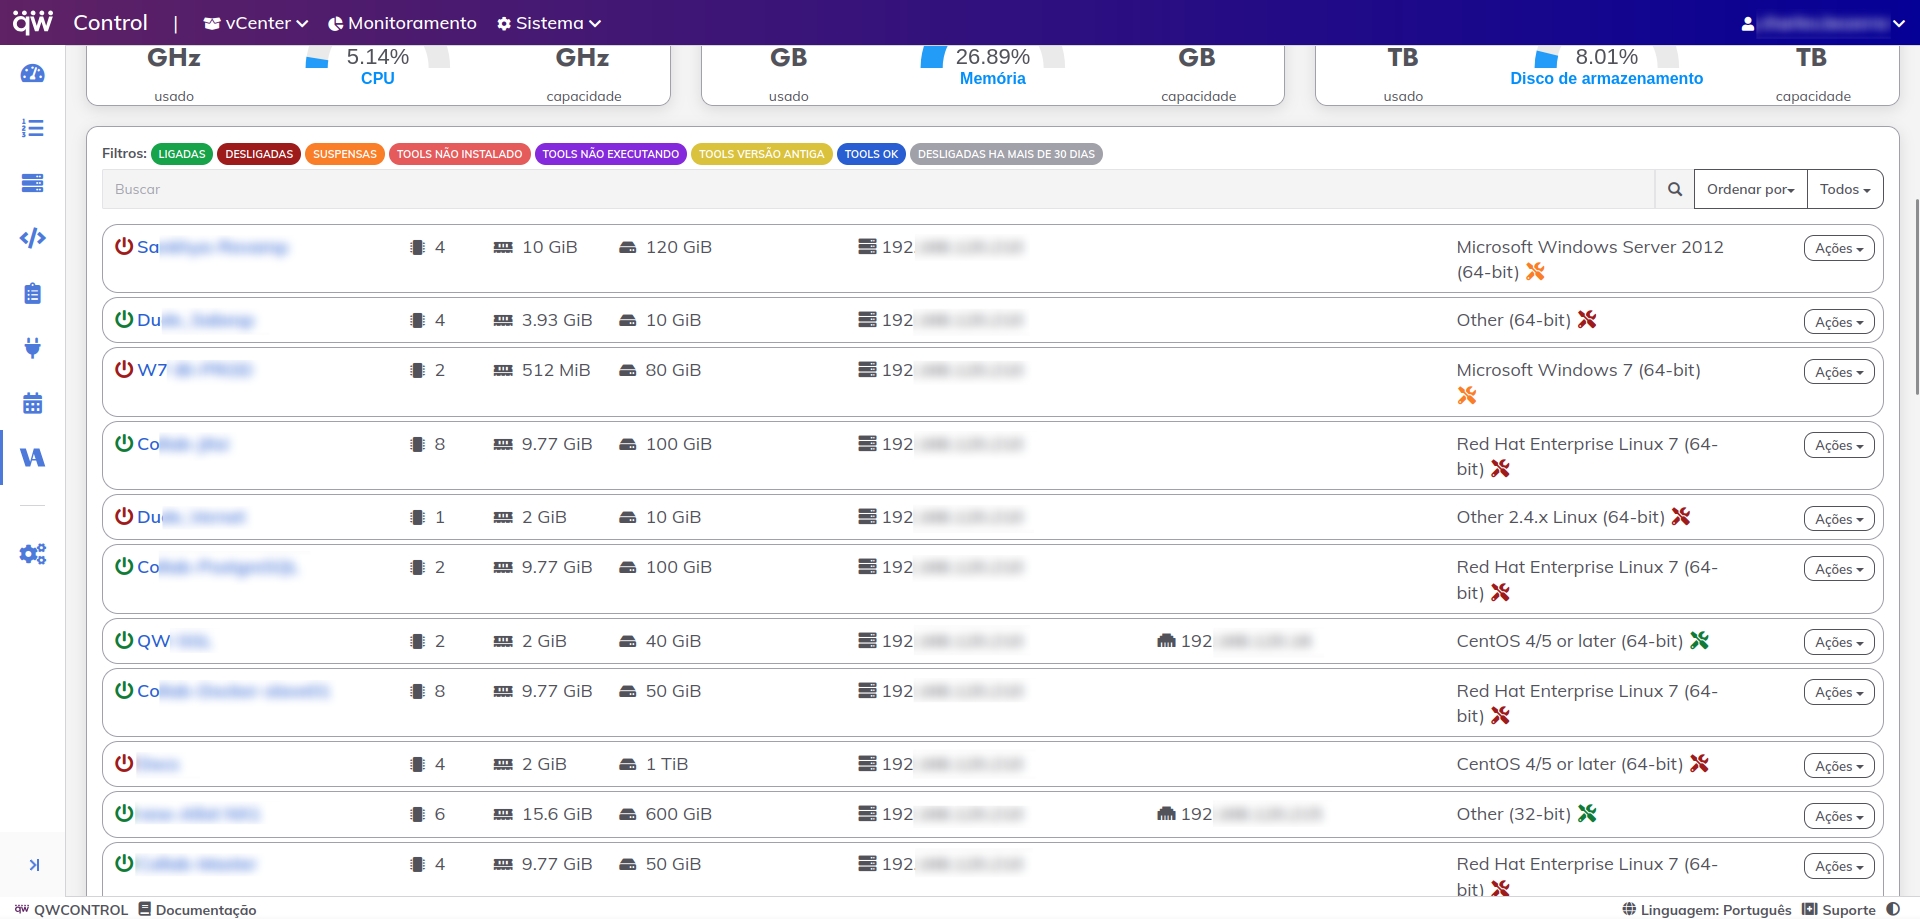
General dashboard of the virtualized VMWare environment, showing the status of 43 virtual machines (powered on, off, and suspended), CPU, memory, and storage usage, along with filters by VM state and detailed view of key instances.

Screen displaying resource usage and list of active VMs on a VMware server, with CPU, memory, disk and operating system details.